About the framework of index
The 2018 Global Innovation Index (GII 2018) is calculated as the average of two sub-indices, namely the innovation input sub-index and the innovation output sub-index (Figure 1). The former gauges elements of an economy which embody innovative activities grouped in five pillars: (1) institutions, (2) human capital and research, (3) infrastructure, (4) market sophistication, and (5) business sophistication. The latter captures actual evidence of innovation results, divided in two pillars: (6) knowledge and technology outputs and (7) creative outputs. Each pillar consists of three sub-pillars and each sub-pillar is composed of several indicators. A total of 80 indicators are adopted to rank 126 economies.
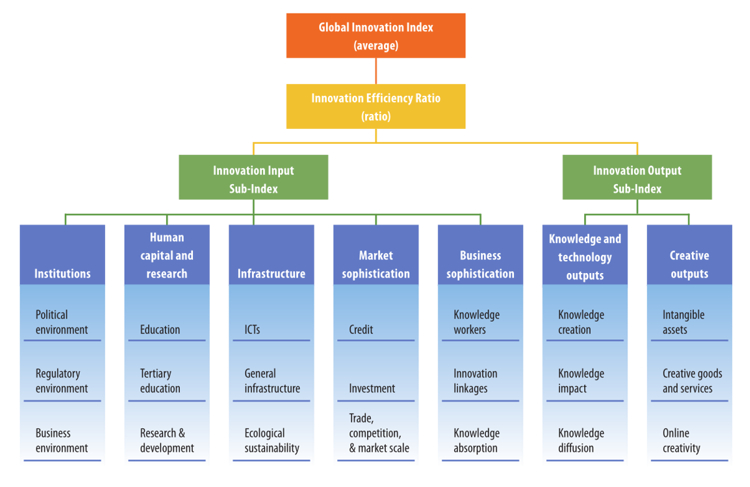
Figure 1 Framework of the Global Innovation Index 2018
It is noticeable that GII 2018 adds the indicator "mobile app creation" in place of the indicator "video uploads on YouTube"; and removes the indicator "ease of paying taxes".
A glance of the global ranking
Themed "Energizing the World with Innovation," GII 2018 is now in its 11th edition. As the index shows, high-income economies take 24 of the top 25 spots (Figure 2), with China the exception. However, innovation in the energy sector is not the privilege of high-income economies. China and India outperform others for their adoption and deployment of renewable energy technologies.

Figure 2 Global Innovation Index 2018 Rankings (Top 25)
Switzerland maintains its top position in the GII for the 8th consecutive year. The United States of America ranks 6th, moving down 2 positions over 2017. China ranks 17th, moving up by 5 spots;
and Hon Kong (China) ranks 14th, up 2 spots. The top 10 economies in 2018 GII still keep the same as those of 2017, with slight change in ranking.
Ranking of China and Hong Kong (China)
China and Hong Kong (China) both gain spots in top 25 in GII 2018, which means both economies have outstanding performance. Anyhow, gaps with other advanced economies still exist. The analysis below will display the rankings of both economies in all seven GII pillars, some noticeable indicators they record and their weakness.
China
Figure 3 displays China’s score and corresponding ranking in terms of all the 80 indicators. As a whole, it moves up by 5 spots with a score of 53.06, becoming the 17th most innovative economy in the world.
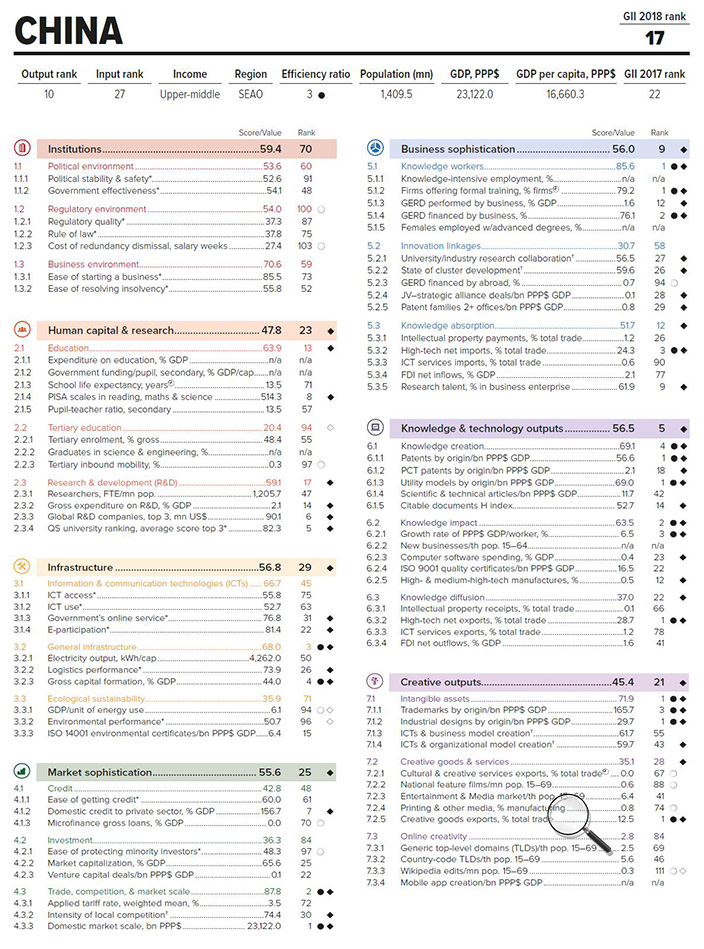
Figure 3 Ranking of China
Regarding the innovation output and input sub-indices, China scores 50.98 and 55.13, ranking 10th and 27th respectively. It achieves an innovation efficiency ratio of 0.92 (ranking 3rd worldwide), which is the ratio of the output sub-index score over the input sub-index score. As an important factor to understand the effectiveness of innovation systems and policies, the efficiency ratio shows how much innovation output a given country is getting for its inputs. However, efficiency ratio alone cannot reflect a given economy’s innovation level. It has to be considered jointly with other factors, such as innovation input sub-index scores, innovation output sub-index scores, and the development stages of economies.
Outstanding performance
China obtains the 27th position in the innovation input sub-index, up by 4 from 2017; attains the 10th position in the innovation output sub-index (Figure 4), up by one from 2017. Indeed, it is the first time that China enters a top 10 ranking in one of the main indices of the GII.

Figure 4 Top 10 in the Innovation Output Sub-Index
In terms of pillars, China tops in knowledge & technology outputs (5th, down 1 position); ranks 23rd in human capital & research, up 2 places; moves up in market sophistication (25th, up 3 places); keeps its 9th position in business sophistication; and moves up in creative outputs (21st, up 5 places). In creative outputs, China goes up in all sub-pillars, especially in online creativity (84th, up 20 positions).
Regarding sub-pillars, what make China noticeable are general infrastructure (3rd), trade, competition, & market scale (2nd), knowledge workers (1st), knowledge impact (2nd) and intangible assets (1st).
As for particular indicators, China stands highest or close to the top, including domestic market scale (1st), firms offering formal training (1st), GERD financed by business (2nd), high-tech net imports (3rd), patents by origin (1st), high-tech net exports (1st), industrial designs by origin (1st), creative goods exports (1st), utility models by origin (1st), growth rate (3rd), and trademarks by origin (3rd).
Thanks to these good rankings, China maintains its first spot among middle-income economies in the quality of innovation.
Areas yet to be improved
Areas for improvement include pillars of institutions (70th, up 8 places); infrastructure (29th, down 2 positions). Though China moves up 8 places in institutions, it still falls into the second half of 126 economies covered in GII 2018. Interestingly, though China moves up or maintain its positions in three sub-pillars of infrastructure, namely information & communication technologies (45th, up 3 places), general infrastructure (3rd) and ecological sustainability (71st, up 7 places), it still falls down in the ranking of this pillar, which means the development of China in this regard lags behind some other economies.
In terms of sub-pillars, what could help China progress in its rise in the GII rankings are regulatory environment (100th), tertiary education (94th), ecological sustainability (71st) and online creativity (84th).
Regarding the indicator of Wikipedia edits, China ranks 111th, which is the worst ranking in China’s performance table.
Hong Kong (China)
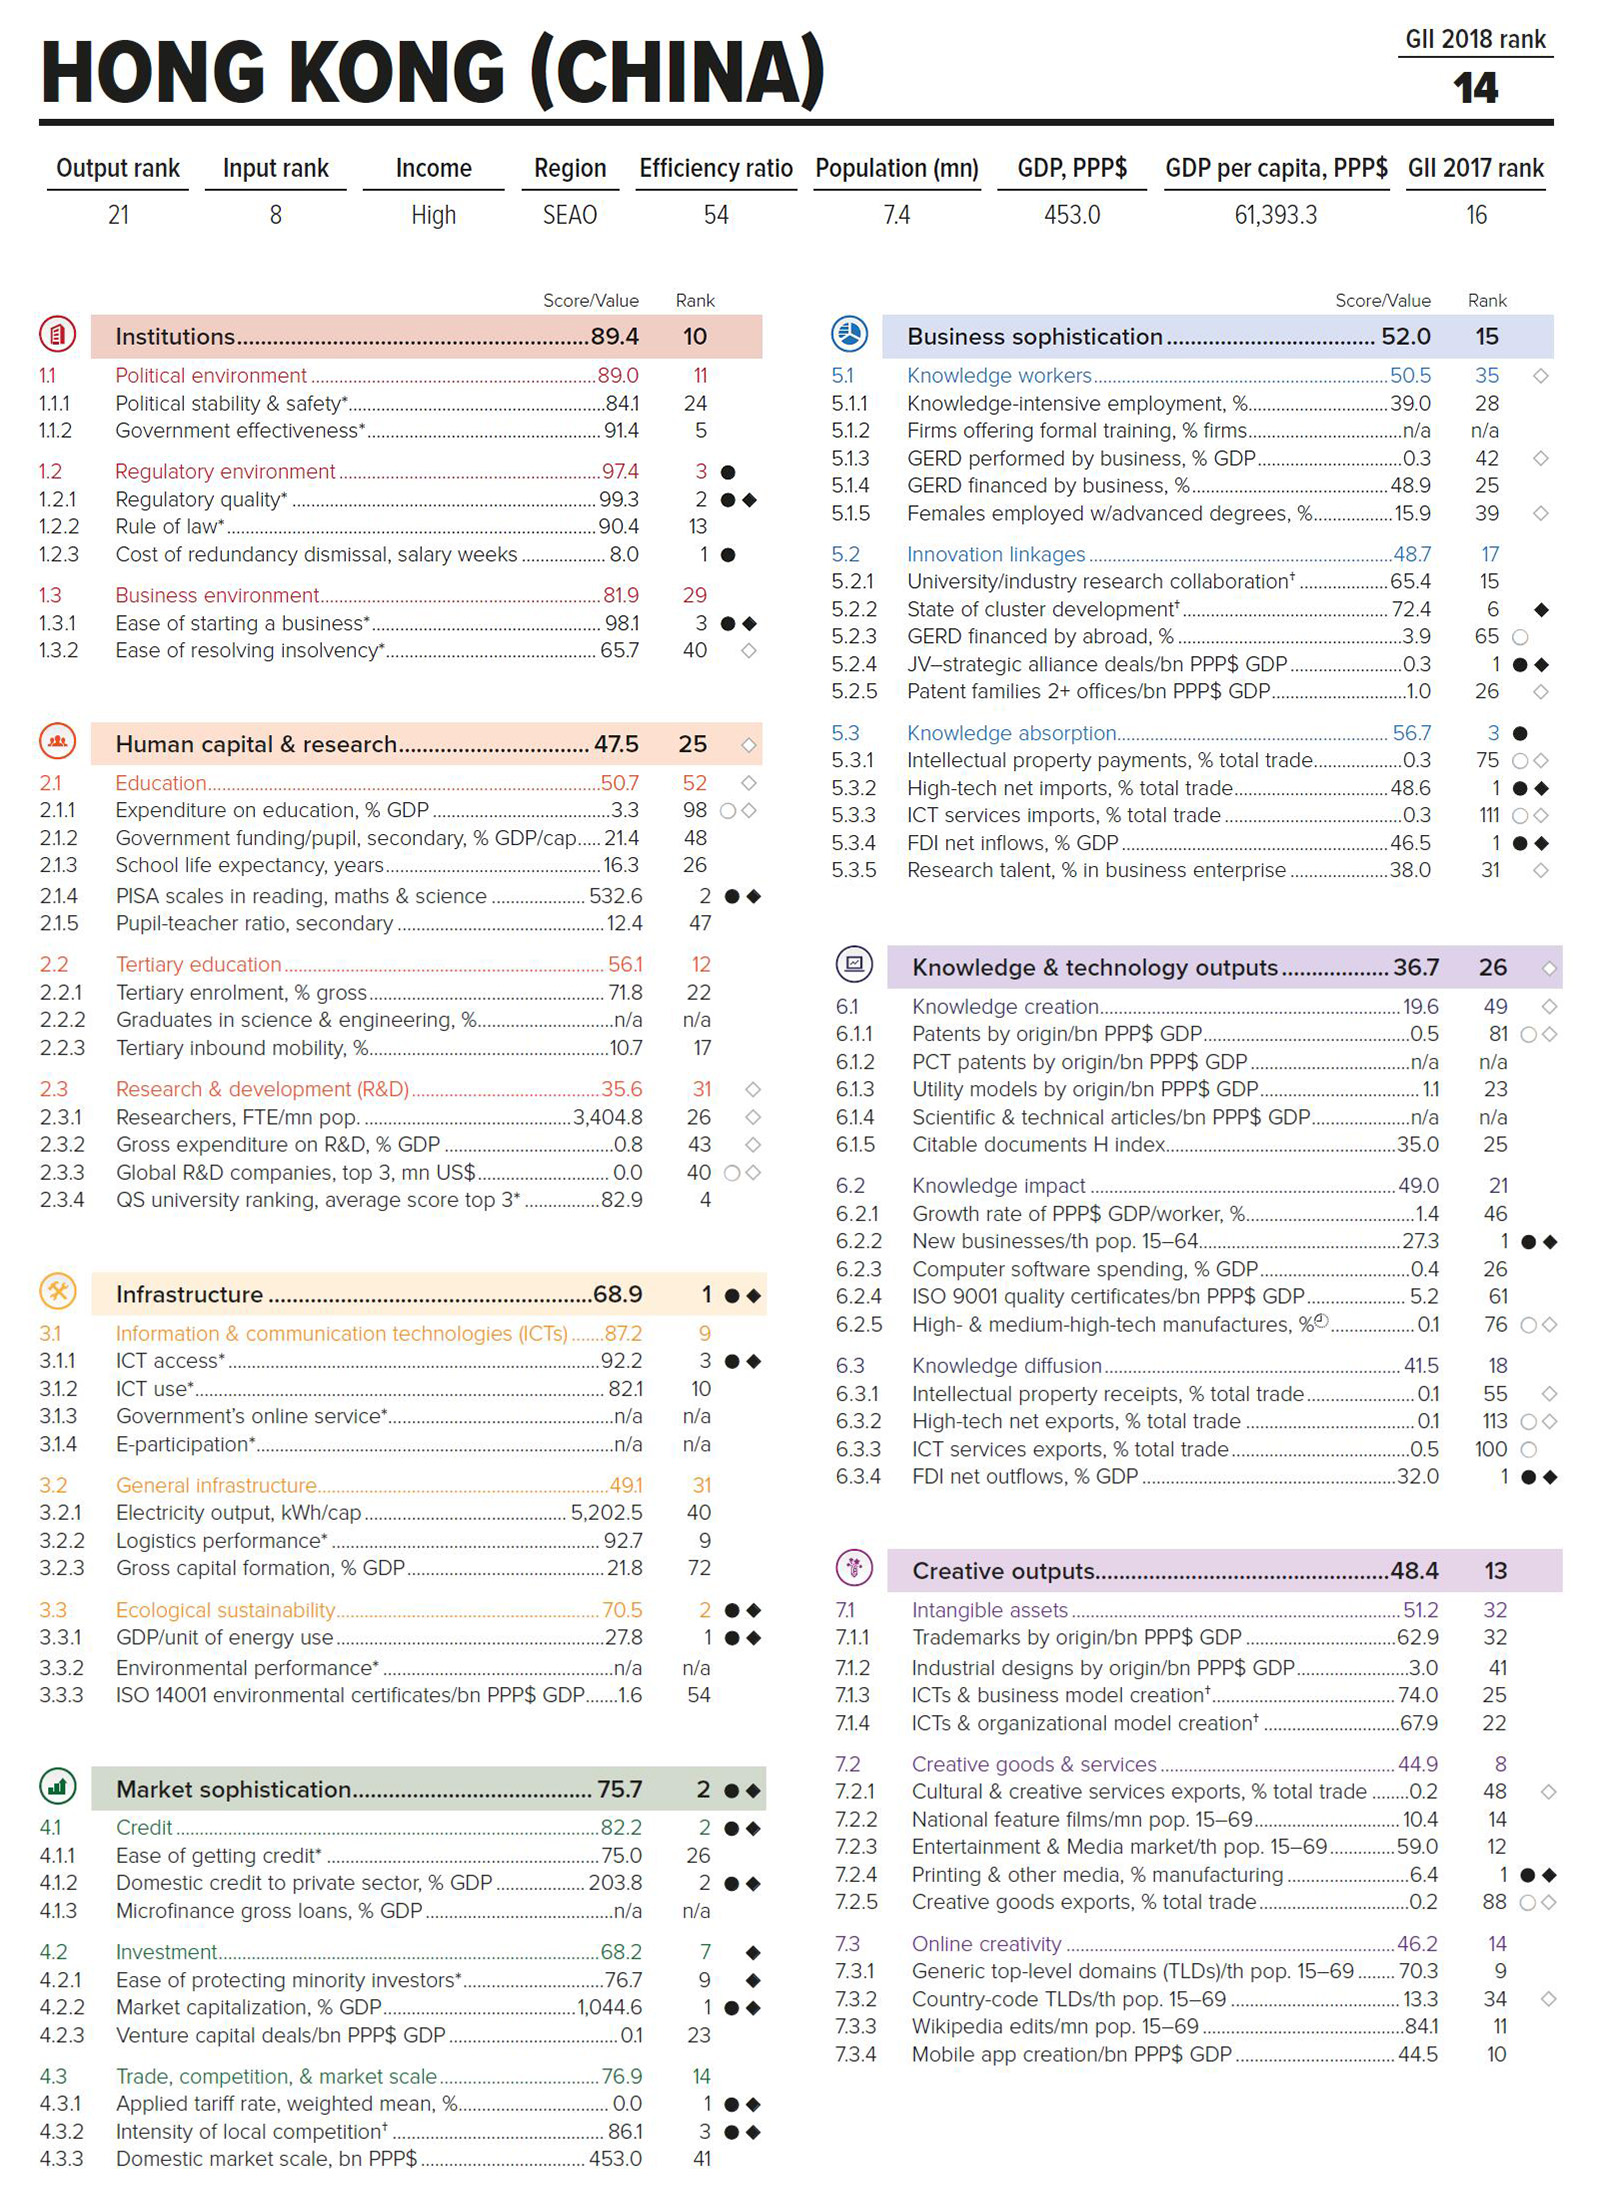
Hong Kong (China) gets a score of 54.62 in GII 2018, moving up 2 positions and ranking 14th.

Figure 5 Ranking of Hong Kong (China)
Regarding the innovation output and input sub-indices, Hong Kong (China) scores 42.53 and 66.71, ranking 21st and 8th, and achieving an innovation efficiency ratio of 0.64 (ranking 54th worldwide). It moves up 19 places over 2017 when it ranks 73rd in innovation efficiency ratio, which may mean Hong Kong (China) obtain more innovation results.
Outstanding performance
Hong Kong (China) is the sole economy in the top 11 through 25 group that shows scores higher than those of economies in the top 10 in 3 pillars: institutions, infrastructure, and market sophistication.
Hong Kong (China) maintains its 8th position in the innovation input sub-index (Figure 6).
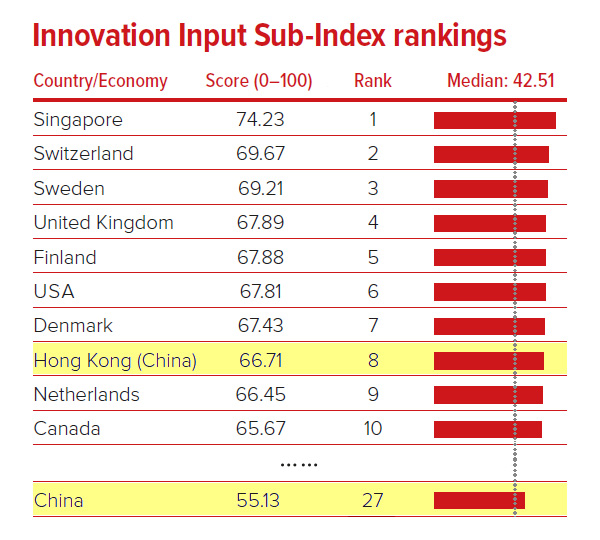
Figure 6 Top 10 in the Innovation Input Sub-Index
At the pillar level, Hong Kong (China) advances to the 1st position in infrastructure, up 3 spots. It retains its good position in market sophistication (2nd), moves up significantly in creative outputs (13th, up 12 positions) and ranks 10th in institutions. Actually, the removal of the indicator ease of paying taxes (ranking 3rd in 2017) leads to its falling in ranking of institutions while its 1st ranking in the indicator printing & other media contributes to the rise in creative outputs.
Hong Kong (China) also achieves improvements in human capital and research (25th, up 3 places) and business sophistication (15th, up 1 place), bringing all its input pillars into the top 25.
At the sub-pillar level, regulatory environment (3rd), ecological sustainability (2nd), credit (2nd), knowledge absorption (3rd) contribute to its entry into top 10 of innovation input sub-index.
In terms of indicator, Hong Kong (China) ranks 1st in 9 areas, including cost of redundancy dismissal and market capitalization.
Areas yet to be improved
Area for improvement is the pillar of knowledge & technology outputs (26th, down 1 place).
In terms of sub-pillars, what could help Hong Kong (China) progress in its rise in the GII rankings are education (52nd) and knowledge creation (49th).
Regarding the indicators, Hong Kong (China) ranks 113th in high-tech net exports, which is the worst ranking in its country profile, 111th in ICT services imports and 98th in expenditure on education.
Conclusion
China’s rapid rise shows the way for other middle-income economies. It is of possibility that Hong Kong (China) as a service based high-income economy will come back to the top 10 in near future though it has exited out since 2015. As the graph below shows, the gap between the two economies in GII rankings is narrowing.
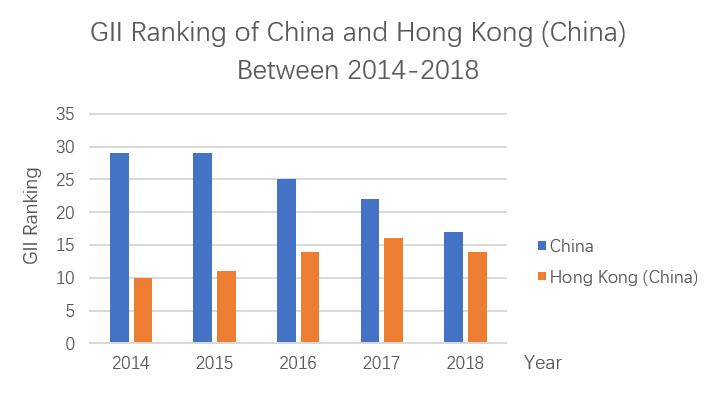
|