GII 2019
The Global Innovation Index (GII) 2019,
themed Creating Healthy Lives – The Future of Medical Innovation, was released
by World Intellectual Property Office (WIPO) jointly with its partners in India
on July 24, 2019. Now in its 12th edition, GII 2019 ranks 129 economies based on
80 indicators. GII has evolved into a valuable benchmarking tool that can facilitate public-private dialogue and where policy-makers, business leaders, and other stakeholders can evaluate innovation progress on an annual basis.
Top 20 in global ranking
Switzerland tops the GII 2019, a position it has held since 2011. According to the press release of WIPO, the solid and strong performance of Switzerland translates to excellent innovation outcomes including patent applications, IP receipts and high-tech manufacturing products.
Sweden returns to the 2nd position, moving up one spot from 2018. The U.S. moves up to the 3rd, up by three spots. Netherlands ranks 4th, down by two spots. The U.K. moves into the 5th position, down by one spot. Finland and Denmark follow, each gaining one position from 2018, taking 6th and 7th place respectively. Singapore ranks 8th this year and, for the third consecutive year, Germany holds the 9th spot. Israel enters the top 10 for the first time, moving up one spot from 2018.
The Republic of Korea ranks 11th. Ireland leaves the top 10 and ranks 12th this year. Hong Kong, China ranks 13th, moving up one spot from 2018. China1 takes the 14th place, moving up 3 spots from 2018. Japan falls 2 spots, ranking 15th. France maintains its 16th position. Canada moves up one spot into 17th. Luxemburg ranks 18th, falling 3 spots. Norway holds its 19th position. Iceland ranks 20th, moving up 3 spots.

Top 20 in Global Innovation Index 2019
It is worth noting that the geography of innovation is changing.
In the top group, Switzerland, Sweden, and the United States
of America (U.S.) lead the innovation rankings, with the latter
two moving up in GII 2019. Other European nations, such as the
Netherlands and Germany, along with Singapore in Asia, remain
consistent members of the GII top 10. This year, Israel moves
up to the 10th position, marking the first time an economy from
the Northern Africa and Western Asia region cracks the top
10 rankings.
Key findings in 2019
Key findings are summarized in GII 2019 as follows:
● Despite economic uncertainty, innovation is blossoming.
● The geography of innovation is changing. Middle-income economies, especially in Asia, are increasingly on the rise. China, continues upward rise, moving to 14th from 17th in 2018, and remaining the only middle-income economy in the top 30.
● Innovation inputs and outputs remain concentrated in a few economies and regions. Moving from a successful middle-income economy with innovation potential into an innovation powerhouse remains hard. On a regional level, continuous innovation performance improvements are primary happening in Asia.
● Some economies get more return on their innovation investments than others. Some economies simply achieve more with less. China stands out for producing innovation output that is equivalent to Germany, the U.K., Finland, Israel, and the U.S..
● Most top science and technology clusters are in the U.S., China, and Germany.
● The GII makes a modest attempt at measuring innovation quality. The ranking of middle-income economies in these innovation quality indicators remains steady, with China, India, and the Russian Federation in the top 3 positions. Positioned 15th globally, China is the only middle-income economy that is closing the gap with the high-income group in all three indicators (the quality of local universities, the internalization of patented inventions and the quality of scientific publications).
Performance of China and Hong Kong, China
“The rise in the GII by economic powerhouses like China and India have transformed the geography of innovation and this reflects deliberate policy action to promote innovation,” said WIPO Director General Francis Gurry. Both China and Hong Kong, China move up in the ranking of GII 2019.
Anyhow, gaps with other advanced economies still exist.
| |
2015 |
2016 |
2017 |
2018 |
2019 |
| China |
29 |
25 |
22 |
17 |
14 |
| Hong Kong, China |
11 |
14 |
16 |
14 |
13 |
The Ranking of China and Hong Kong, China in GII, 2015 to 2019
China is number 14, up 3 spots from 2018;
and Hong Kong, China is number 13, up 1 place. As the table
above shows, China maintains upward rise in GII ranking from 2015 to 2019, while Hong Kong, China presents modest ups and downs. Most
notably, China makes an impressive improvement in the Innovation Output Sub-Index this year, reaching the 5th position worldwide—the year in which it reached the
top 10 in the GII Output Sub-Index for the first time.
China
The top-performing economies in the GII are almost exclusively from the high-income group. China is the only exception. It moves to 14th place in GII 2019. It ranks the 26th position in the Innovation Input Sub-Index, up by 1 position; and improves to 5th in the Innovation Output Sub-Index, up
by 5 positions from 2018.

It ranks in the top 20 in the pillars of Business sophistication (14th), Knowledge and technology outputs (5th) and Creative outputs (12th).
China improves its performance in four pillars: notably in Institutions (60th, up by 10 spots), Infrastructure (26th, up by 3), Market sophistication (21st, up by 4), and Creative outputs (12th, up by 9). In these four pillars, it improves the most in the following sub-pillars: Political environment (47th, up by 13 positions), Business environment (48th, up by 11 positions), Investment (64th, up by 20) and Creative goods & services (15th, up by 13).
In total, China’s innovation strengths become evident in numerous areas. It maintains top ranks in Patents by origin, Industrial designs, and Trademarks by origin as well as High-tech net exports and Creative goods exports.
Outstanding performance
Standing out for producing innovation out—China is one of the only 3 middle-income economies that perform as well on most GII innovation input and output measures as the high-income group. China stands out for producing innovation out that is equivalent to Germany and other high-income economies.
Holding the second most S&T clusters—Regarding the top 10 science and technology (S&T) clusters, Shenzhen-Hong Kong ranks 2nd with 18 clusters (2 more than in 2018).
The most innovation economy by income group—In terms of innovation performance by income group, China ranks the top in upper-middle income group, followed by Malaysia and Bulgaria.
Ranking 3rd in the quality of universities—China takes the 3rd spot in 2019 (moving up from 5th position in 2018). Regarding the quality of publications, China takes the top position among the middle-income economies.
Areas yet to be improved
Despite this good performance, China also presents areas of relative weakness in several sub-pillars, which include regulatory environment (100th) and tertiary education (94th). Opportunities for further improvement in indicators include Cost of redundancy dismissal, salary weeks (107th), Tertiary inbound mobility, % (101st)
and Wikipedia edits/mn pop. 15-69 (111th).
Hong Kong, China
Hong Kong, China ranks 13th in the GII 2019, increasing by 1 rank from last year. It increases by 5 spots in the Innovation Output Sub-Index (16th), and keeps its rank in the Innovation Input Sub-Index (8th).
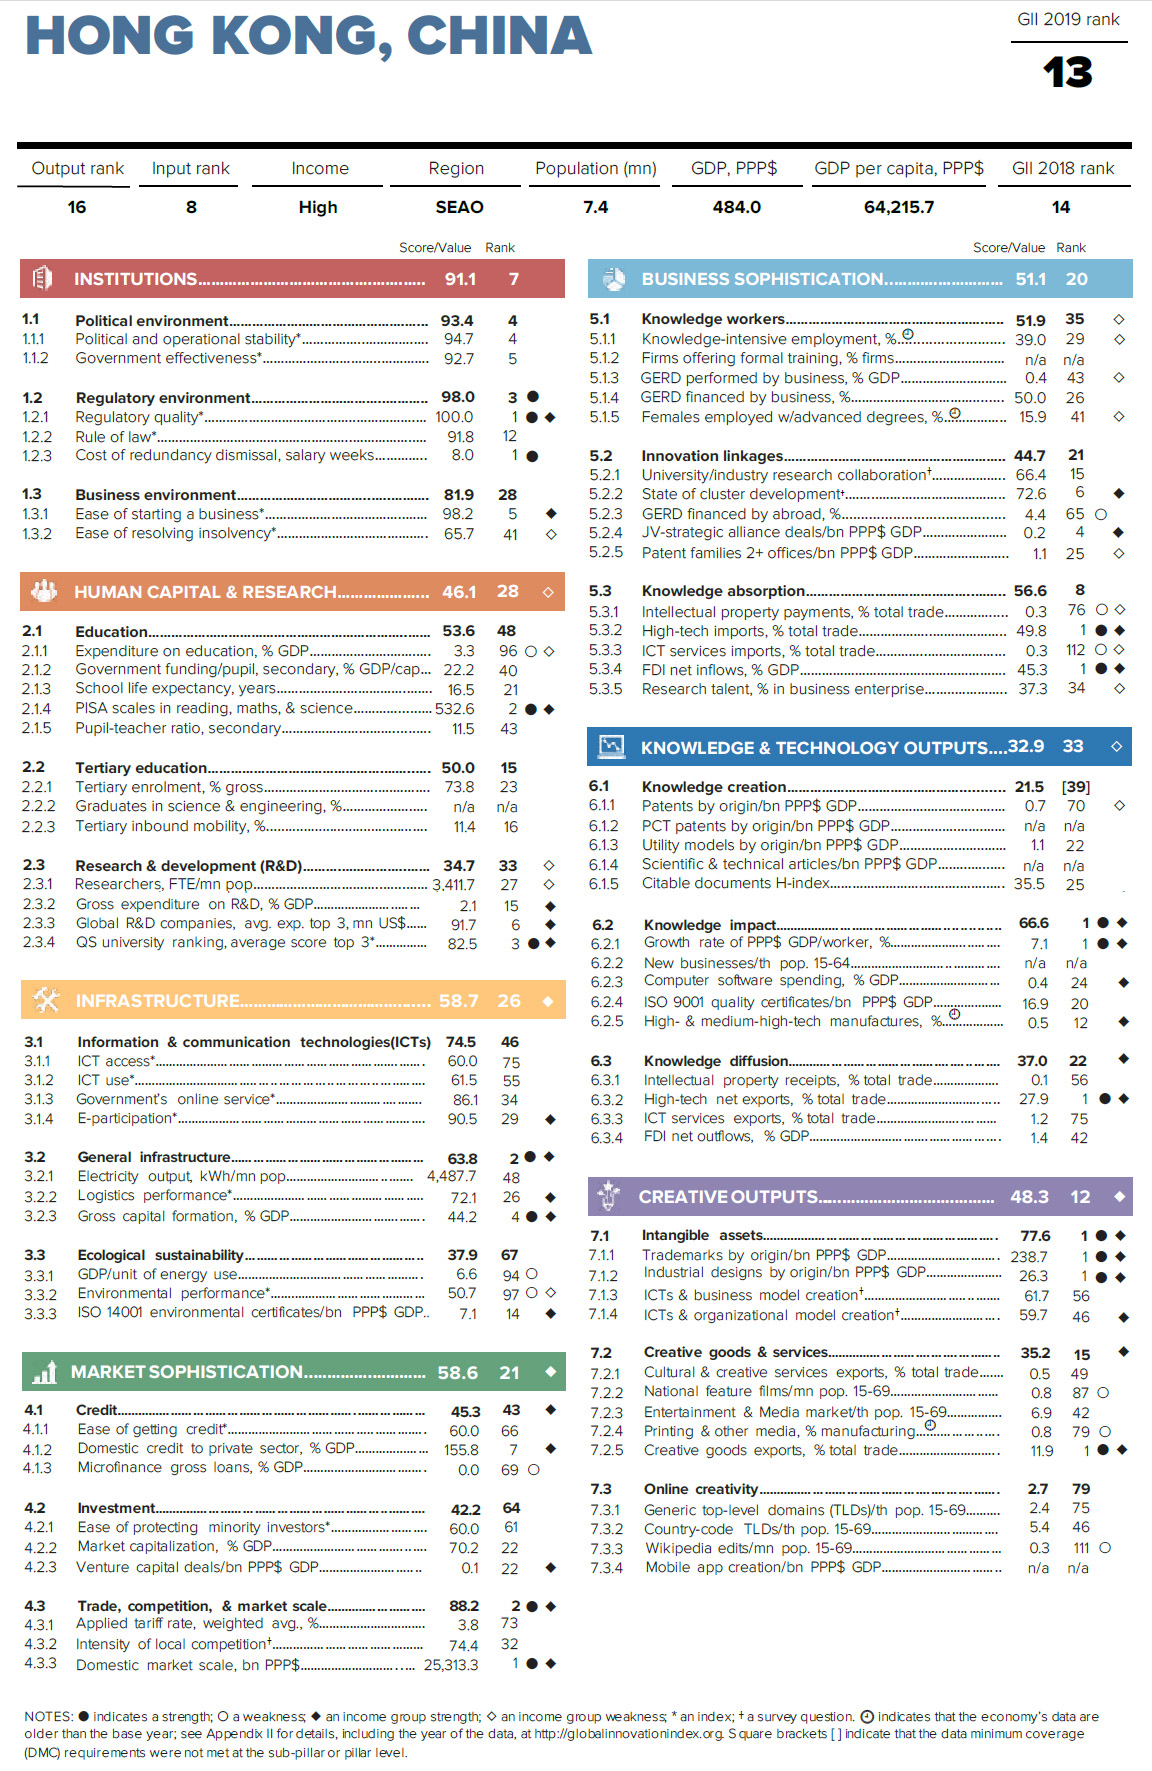
Hong Kong, China remains in the top 20 in the pillars of Institution (7th), Infrastructure (4th), Market sophistication (3rd), Business sophistication (20th) and Creative outputs (3rd).
Compared with 2018, it improves its performance in 2 of the 7 pillars: Institutions (7th, up by 3) and Creative outputs (3rd, up by 10). In these two pillars, it improves the most in the following sub-pillars: Political environment (4th, up by 7) and Creative goods & services (1st, up by 7).
In addition, it ranks 1st in 12 indicators such as Regulatory quality, Cost of redundancy dismissal, and salary weeks. Government effectiveness and Ease of starting a business also rank well (5th rank overall). Hong Kong, China also retains good rankings in Market sophistication (3rd)
and Infrastructure (4th). It ranks in the top 3 in several indicators, such as
PISA results, GDP per unit of energy use, Domestic credit to private sector,
High-tech imports, and FDI net inflows.
Outstanding performance
The 3rd most innovation economies by region—GII ranks the innovation performance of economies around the world. In 2019, Hong Kong, China marks a new entrant into the top 3 in the region of South Asia, East Asia, and Oceania. It also keeps above expectations for level of development.
Among top 10 economies in the Innovation Input Sub-Index—Hong Kong, China keeps the 8th spot in the Innovation Input Sub-Index for the third consecutive year.
Areas yet to be improved
There is still room for further improvement in such indicators as Expenditure on education, % GDP (96th), High-tech net exports, % total trade (104th) and ICT services exports, % total trade (103rd).
Other relative weaknesses on the input side include Global
R&D companies, GERD financed by abroad, IP payments, and ICT services imports. Framework of indicators and adjustment
As the previous editions, the GII 2019 is calculated as the average of two sub-indices. The Innovation Input Sub-Index gauges elements of the national economy which embody innovative activities grouped in five pillars: (1) Institutions, (2) Human capital and research, (3) Infrastructure, (4) Market sophistication, and (5) Business sophistication. The Innovation Output Sub-Index captures actual evidence of innovation results, divided in two pillars: (6) Knowledge and technology outputs and (7) Creative outputs.
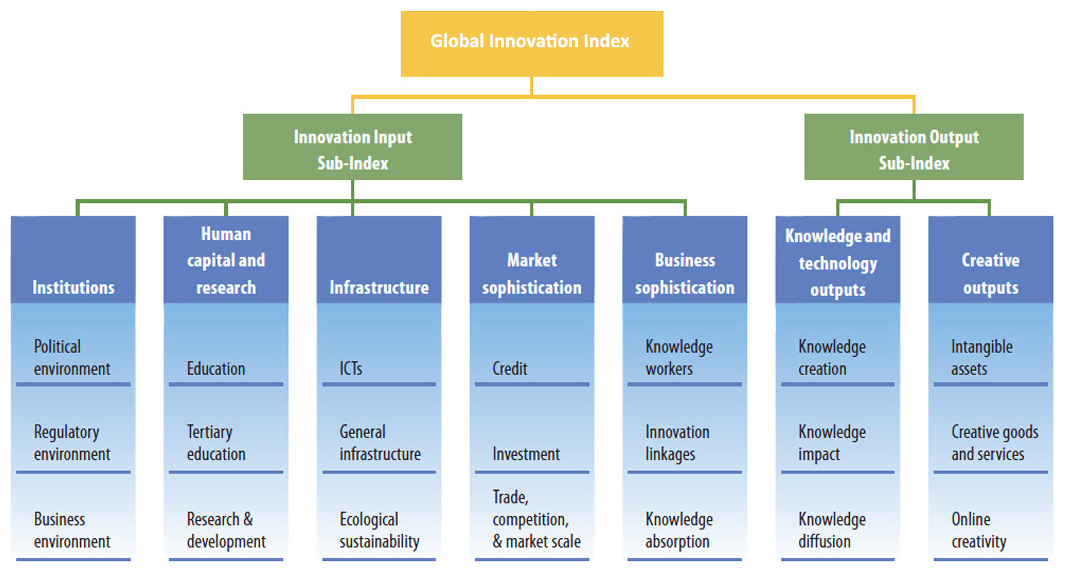
Framework of the GII
However, a total of seven indicators were modified this year. One indicator was replaced, five underwent methodological changes, and one’s methodology changed at source.
Indicator 1.1.1 Political stability and safety is replaced by the indicator Political and operational stability. The methodology underpinning indicators 3.3.2 Environment performance, 5.3.1 Intellectual property payments and 6.3.1 Intellectual property receipts is updated.
Data for indicator 5.3.2 High-tech net imports are sourced directly from the United Nations Comtrade rather than from
the World Integrated Trade Solutions (WITS). The change affects the calculation for net totals.
For indicator 6.2.1 Growth rate of GDP PPP$ per worker, the methodology changed to capture the average of the three most recent years to produce a more stable variable.
Indicator 7.3.4 Mobile app creation, introduced last year to measure the number of mobile apps created in an economy, was adjusted this year to measure the global downloads of mobile apps by origin of the headquarters of the developer
or producing firm.
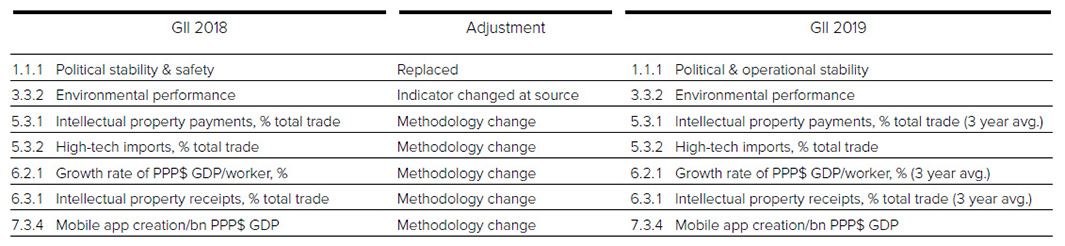
Changes to the indicators of GII 2019
1 As indicated by the report, the terms ‘country’,
‘economy’, and ‘nation’ do not in all cases refer to a territorial entity that
is a state as understood by international law and practice. The terms cover
well-defined, geographically self-contained economic areas that may not be
states but for which statistical data are maintained on a separate and
independent basis.
|
